View Windows Agent Details and Alerts
View Windows Agents on the Lacework Console
After you successfully install and configure the agent on your Windows host, it is displayed in the Lacework Console.
- In the Lacework Console, click Agents.
- Examine the Agent Monitor table. All Lacework agents registered with the Lacework server appear in the list of agents.
- Identify the list of Windows agents by sorting on the Agent OS column. The label Windows indicates a Windows agent.
- Locate your newly-installed Windows agent. This is verification that your Windows agent is connected to the Lacework server.
- Click the hostname of your agent to view the details of the Windows host machine running the agent.
View Machine Details on the Lacework Console
After successfully installing and configuring the Windows agent on your Windows host, the Lacework Console collects and displays information about each Windows host machine.
- Go to Resources > Host > Machines.
- Examine Machine Properties. All hosts registered with the Lacework server appear in the list.
- In the search field, type
Windowsto filter for Windows hosts. - Locate the host machine running the newly-installed Windows agent. This is verification that the agent running on the Windows host machine is registered with the Lacework server.
- Click on the host name to open the details of the Windows host machine running your agent.
- Examine Machine Tag Summary. This displays all the tags and details for the host machine.
- In the search field, type in a specific tag you want to examine.
View the Lacework Polygraph
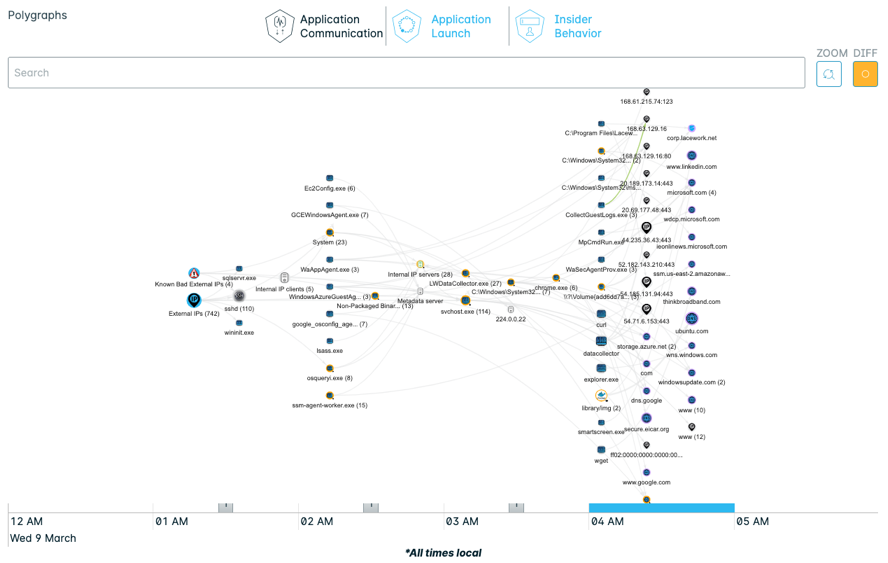
The Lacework polygraph detects anomalies, generates appropriate alerts, and provides a tool for users to investigate and triage issues.
Use the polygraph to:
- Monitor your Windows workload.
- Spot configurations that violate compliance.
- See security gaps and changes that could put your company at risk.
The polygraph technology dynamically develops a behavioral model of your services and infrastructure. The model understands natural hierarchies including processes and machines. It then develops behavioral models that the polygraph monitors for activities that fall outside the model’s parameters. In addition, the polygraph continually updates its models to:
- Pinpoint exactly how a file changes.
- Investigate anomalous events and activities related to FIM signals.
- Provide cloud-wide capabilities for search, file type summaries, and detection of new files.
View the Polygraph
In the Lacework Console, go to Workloads > Hosts and select a dashboard to examine.
Scroll down to view the Lacework polygraph.

If the number of clustered nodes is greater than 3000, then the polygraph does not appear. Instead, the following message appears:
Add filters at the top of the page to view the polygraph.
To view the polygraph, add filters in the filter field at the top of the page.